In module one we learned to use different combinations of color bands to create aerial images emphasizing various aspects of the image.
The top image is false color infrared, combining red, green, and near infrared bands. It is useful for identifying types and health of vegetation.
Middle image is true color, composed of blue, green, and red bands. It makes identifying certain features easier, since they appear on the image the same way they appear in real life.
The bottom image, Landsat 8, while it provides only shades of gray, it has the highest resolution of the three images.
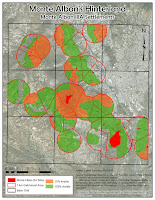
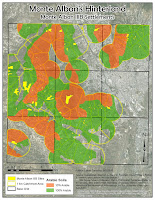 My final project examines increase of catchment area of a community through creation of satellite communities. I examined Monte Alban IIIA and IIIB periods in the area directly around Monte Alban itself.
To get the data I needed, surface area statistics, I georeferenced and digitized the soil maps, then created separate shapefile with only the arable areas. Next I digitized the sites and created 1 Km buffer around them to represent the catchment area. The important part of this step was to "dissolve all" buffer zones, in order to create a single large area, rather than a number of overlapping circles. Then I clipped the soil map to the catchment area, create Thiessen polygons to divide the catchment area between all sites, and calculated surface areas for various types of soils.


