GIS Journal
Thursday, October 27, 2016
Biscayne Shipwrecks: Analysis
Thursday, October 20, 2016
Biscayne Shipwrecks - Prepare Week
In this module we are using methods utilized in previous modules to analyze seafloor of Biscayne Bay in search of shipwrecks. Data used for this is somewhat different than for terrestrial analysis. We are using bathymetric data, as well as navigational charts, both current and historical. Navigational charts, especially historic ones must be georeferenced, which may be difficult to get vary close due to erosion and fluctuating coastline.
Monday, October 10, 2016
Scythian Landscapes - Report
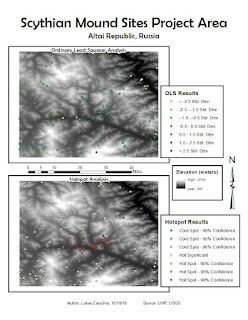
Data presented in this file shows
spatial distribution of known Scythian burial mounds. Data also shows random
points in the project area, and the probability of those points being a burial
mound site. Secondary surfaces generated for analysis were slope, aspect, and
elevation. Slope favored incline of less than 16%, aspect favored south facing
slopes, and elevation favored areas below 2000 meters. Linear regression method
used was Ordinary Least Squares analysis. Missing data includes mound site
distance from the river. Limitation of this model the limited number of points
used for spatial distribution of data.
The OLS
results include the adjusted R-squared value of 0.697804, which means the
variables are explaining about 68% of site presence or absence. The
coefficients are not near zero, and are mostly positive, which means they have
a positive, direct influence on the data. The Spatial Autocorrelation test has
the following z-score and p-value values: z-score of 13.834296 and p-value of
0.00000. The combination of high z-score and low p-value indicates a normal
distribution of the data and spatially autocorrelated data.
Sunday, October 2, 2016
Scythian Landscapes - Analyze Week
In this part of the module we prepared base data for Landscape Modeling of the region. From the raster created last week we created, we created a number of separate data rasters.
Using last week's raster I extrapolated elevation values for the area. I used those values to determine slope steepness, and slope facing. In this case South facing slopes were more favorable to slopes facing other directions. I also created a contour map of the region.
Lastly, I created a shapefile with locations of Scythian burial mounds.
Sunday, September 25, 2016
Scythian Landscapes - Prepare Week
First part of Scythian Landscapes module focused on preparing the data. This involved finding and downloading DEMs of the area, and creating a raster mosaic out of them. Then the mosaic raster was clopped to the provided study area shapefile.
Second part of the module was to take an aerial image of the mound site, and georeference it based on coordinates provided. Visual georeferencing was not possible, due to very poor resolution of the background image.
Second part of the module was to take an aerial image of the mound site, and georeference it based on coordinates provided. Visual georeferencing was not possible, due to very poor resolution of the background image.
Wednesday, September 21, 2016
Predictive Modeling
In this module we performed predictive modelling of an area. The model was divided into three site categories, high, medium and low probability. These categories were based on slope and proximity to a waterway.
First I created a raster out of a mosaic of smaller rasters. Then I extrapolated elevation values for the area. I those values to determine slope steepness, and slope facing. In this case South facing slopes were more favorable to slopes facing other directions. Lastly I used a separate shapefile of streams and rivers in the area, created a buffer around it representing optimal settlement distance from the waterway. Lastly I combined the slope and waterway data to determine site probability in the area.
First I created a raster out of a mosaic of smaller rasters. Then I extrapolated elevation values for the area. I those values to determine slope steepness, and slope facing. In this case South facing slopes were more favorable to slopes facing other directions. Lastly I used a separate shapefile of streams and rivers in the area, created a buffer around it representing optimal settlement distance from the waterway. Lastly I combined the slope and waterway data to determine site probability in the area.
Monday, September 12, 2016
Finding Pyramids
During week 3 we identified possible pyramid locations in densely forested areas. The map included here shows area surrounding Angkor Wat it Cambodia.
The supervised classification is based on false color infrared base raster image. Considering the base color band combination, any possible pyramid sites will be very difficult to spot, if not impossible. This is in part due to healthy vegetation overgrowing the ruins showing in the same shades and tones as all other healthy vegetation.
The supervised classification is based on false color infrared base raster image. Considering the base color band combination, any possible pyramid sites will be very difficult to spot, if not impossible. This is in part due to healthy vegetation overgrowing the ruins showing in the same shades and tones as all other healthy vegetation.
Subscribe to:
Comments (Atom)


